
The changing demographics of retail investors

The figure is a bar chart showing share of individuals transferring funds to investment accounts in 2010-15 (the yearly average), 2019, 2021, and 2023. The plot breaks out individuals by two age groups: forty and higher versus below 40. The y-axis is scaled so that the 2010-15 average is 100, which is indicated as 3.6 percent for the forty plus group and 4.3 percent for the under 40 group. The bars for both age subsets rise in 2019, rise further in 2021 and fall somewhat from the 2021 peak in 2023 but remaining notably higher than 2019. While these shifts are directionally the same for both groups, the moves are larger for the below 40 group, leaving them at a level of over 300 compared with under 250 for the 40 plus group.
Related Stories
 Stocks & Markets
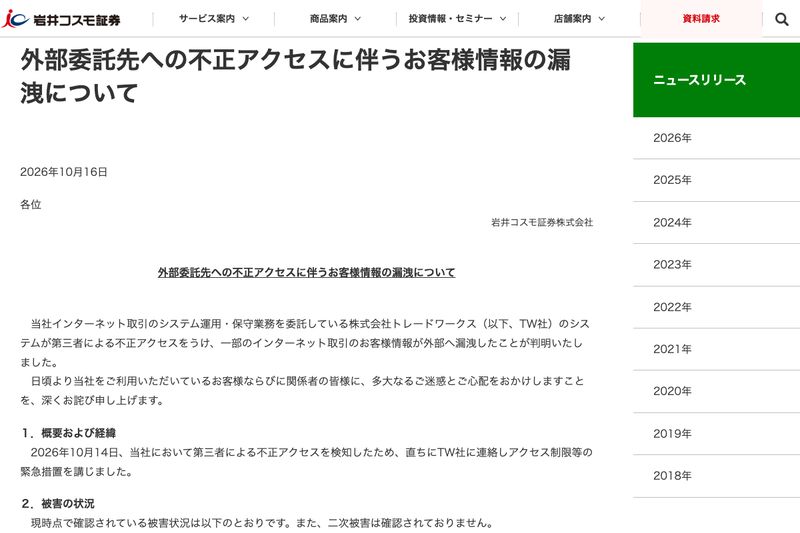
Iwai Cosmo Securities: 4,611 Customer Records Leaked Due to Unauthorized Access at Outsourced Partner
5 days ago
 Stocks & Markets
Stocks to Watch Today: ICICI Bank, HDFC Bank, Axis Bank, GPT Infra, RailTel, ACME Solar, Yes Bank, Urban...
5 days ago
 Stocks & Markets
Japanese Stocks Slide Amid Tech Selloff
5 days ago
 Stocks & Markets
Oxford spin-out OMass Therapeutics lands €275 million to bring novel small-molecule therapies closer to patients
1 week ago
 Stocks & Markets
Tech stocks erase $1 trillion of wealth as oil surges to $110 for the first time since May
1 week ago
 Stocks & Markets
Tech stocks tumble as AI debt fears rattle Wall Street
1 week ago
 Stocks & Markets
Stocks rebound after tech sell
1 week ago
 Stocks & Markets
Sensex Edges Higher on Tech Gains
1 week ago